
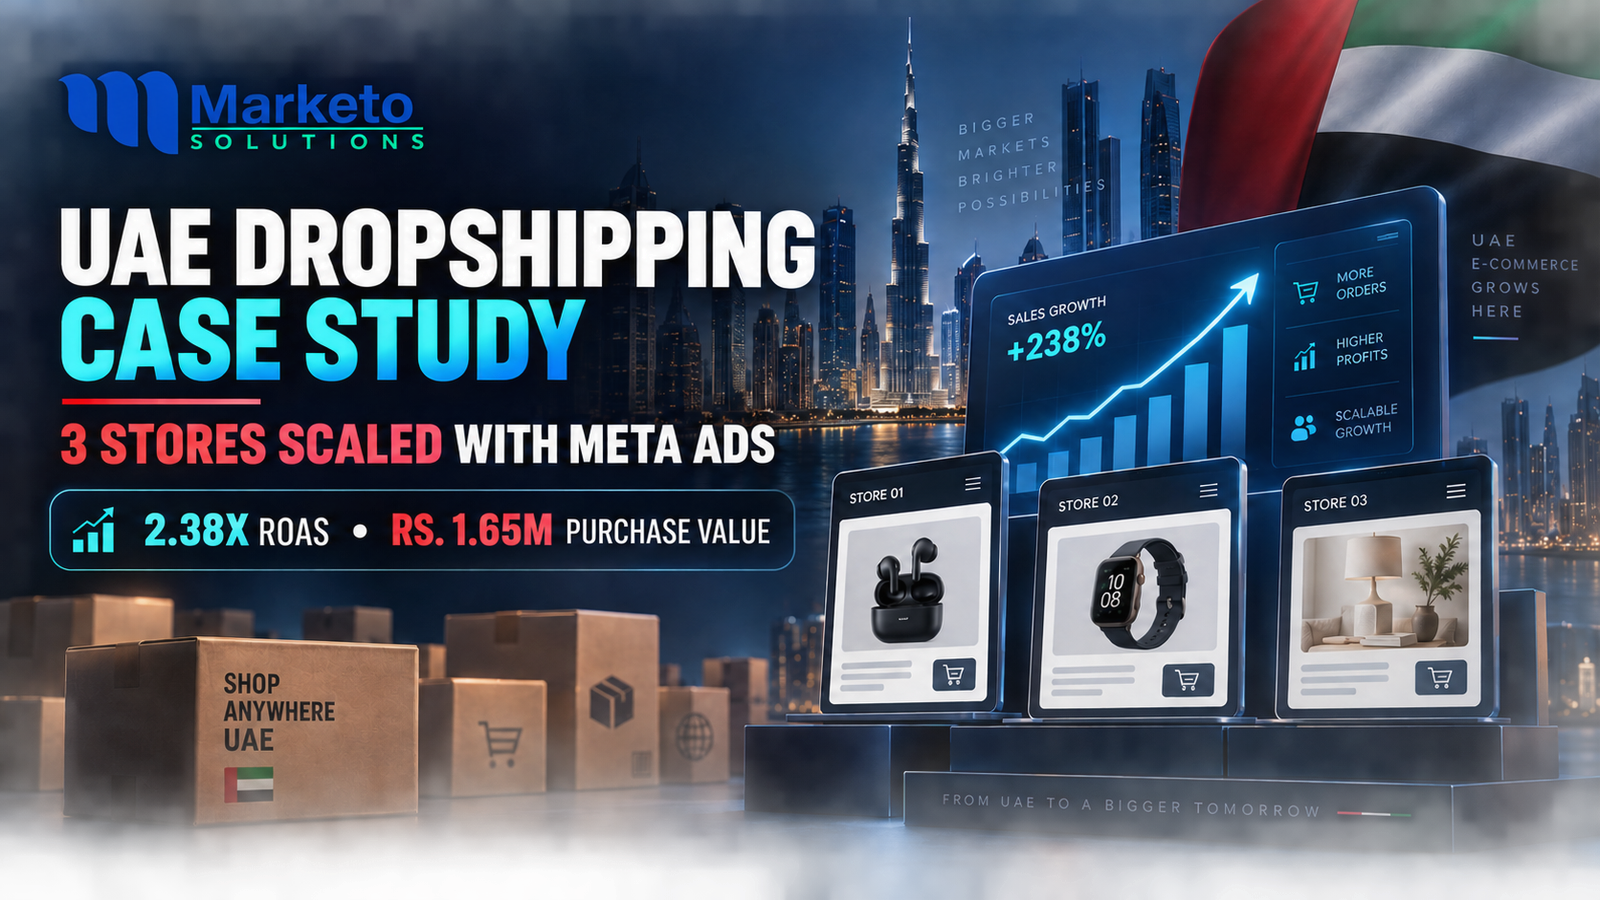
Launching a dropshipping store is easy. Building a store that consistently generates purchases while keeping advertising costs under control is the real challenge.
This case study explains how Marketo Solutions planned, tested and scaled Meta advertising campaigns for three different dropshipping businesses targeting the UAE market. Each store had a separate advertising account, product mix and performance level, so the results have been presented individually instead of being combined into one misleading success story.
Across the two accounts with complete spend and purchase-value totals visible, the campaigns generated Rs.1,651,710.50 in tracked purchase value from Rs.692,910.85 in advertising spend, producing a combined 2.38x ROAS. A third account recorded a 3.13x average purchase ROAS during the selected reporting period.
Data note: The figures in this case study were taken from Meta Ads Manager screenshots supplied for the three separate advertising accounts. Meta’s “purchase conversion value” represents tracked revenue attributed to advertising. It should not automatically be treated as delivered revenue or net profit.
Case Study at a Glance
| Area | Details |
|---|---|
| Market | United Arab Emirates |
| Business model | Ecommerce dropshipping |
| Advertising channel | Meta Ads |
| Number of stores | 3 separate stores/accounts |
| Main objective | Generate purchases and scale winning campaigns |
| Core approach | Product testing, creative testing, campaign optimization and controlled scaling |
| Combined verified ad spend* | Rs.692,910.85 |
| Combined tracked purchase value* | Rs.1,651,710.50 |
| Combined blended ROAS* | 2.38x |
*Combined totals include Store 2 and Store 3, where complete account-level spend and purchase-value figures were visible.
The Challenge
UAE dropshipping is a competitive business model. Customers have many product choices, advertising costs can rise quickly, and cash-on-delivery businesses may also face cancelled or returned orders. A campaign can generate activity without generating sustainable profit if the product, offer, creative and landing page are not aligned.
The three stores needed more than traffic. They required a connected system that could:
- identify products with genuine buying potential;
- present those products through conversion-focused store pages;
- test different audiences, offers and creatives;
- measure purchases rather than vanity metrics;
- reduce cost per purchase;
- move budget toward winning campaigns; and
- protect profitability while scaling.
Marketo Solutions approached each store as a separate business rather than applying one identical campaign structure everywhere.
The Objectives
The campaign objectives were clear:
- Generate measurable website purchases through Meta Ads.
- Test multiple products and creative directions without wasting the full budget on unproven ideas.
- Identify campaigns capable of producing repeatable returns.
- Scale the strongest campaigns while monitoring cost per purchase and ROAS.
- Improve the overall ecommerce journey from advertisement to product page and checkout.
For businesses starting from zero, Marketo Solutions can support the complete journey through its dropshipping business services, including store setup, product strategy, launch support and growth planning.
Our Start-to-Scale Strategy
1. Product and Market Research
The first step was to evaluate products according to UAE market demand, selling price, visual appeal, customer problem, competition and potential margin. Products that looked attractive but offered limited margin after advertising and fulfilment costs were not suitable for aggressive scaling.
This stage helped establish three important numbers before launch:
- the maximum acceptable cost per purchase;
- the minimum required selling price; and
- the break-even ROAS for each product.
2. Conversion-Focused Store Preparation
Paid traffic cannot compensate for a weak ecommerce experience. The stores and product pages therefore needed clear offers, mobile responsiveness, trust signals, product benefits, pricing clarity and an easy checkout journey.
The goal was to reduce the gap between clicking an advertisement and completing a purchase. Businesses that require a new store or conversion-focused improvements can explore Marketo Solutions’ website development services.
3. Creative and Offer Testing
Different creative angles were tested to determine why a customer would stop, watch and buy. The testing process focused on:
- problem-and-solution messaging;
- product demonstrations;
- benefit-led videos and images;
- offer-focused advertisements;
- urgency and promotional angles; and
- retargeting messages for interested visitors.
The purpose was not simply to produce more advertisements. It was to discover the combination of product, message and presentation that generated purchases at an acceptable cost.
4. Campaign Testing
Initial campaigns were used to collect performance signals. Marketo Solutions monitored link clicks, click-through rate, cost per click, website purchases, cost per purchase, purchase conversion value and ROAS.
Weak campaigns were not allowed to consume budget indefinitely. Campaigns that failed to show buying signals were paused or revised, while stronger campaigns received further testing.
5. Optimization and Scaling
Once campaigns began producing purchases, the focus shifted from discovery to controlled scaling. This included reallocating budget, testing fresh creatives, separating stronger product angles and monitoring whether performance remained stable as spend increased.
Scaling decisions were based on commercial performance—not reach or clicks alone. Marketo Solutions’ broader digital marketing approach connects paid traffic, creative strategy and conversion experience around measurable business outcomes.
Results: Store 1
The first account’s April 2026 campaign view showed strong variation between campaigns. Individual campaigns recorded purchase ROAS figures ranging from 0.47x to 6.12x, while the account view displayed an average purchase ROAS of 3.13x and 5,205 link clicks.
| Store 1 Metric | Result Shown |
|---|---|
| Reporting period | 1–30 April 2026 |
| Link clicks | 5,205 |
| Average cost per link click | Rs.54.95 |
| Average link CTR | 0.64% |
| Average purchase ROAS | 3.13x |
| Highest visible campaign ROAS | 6.12x |
The biggest lesson from this account was that not every campaign deserved equal investment. The difference between 0.47x and 6.12x ROAS showed why campaign-level analysis and budget reallocation were essential.
Because the screenshot did not show a reliable complete spend and total purchase-value figure for the account, those values have not been estimated or added to the combined financial totals.
Results: Store 2
The second store demonstrated the impact of moving budget toward campaigns that had already produced purchase signals. The account-level totals showed Rs.382,577.18 in advertising spend and Rs.995,030.14 in tracked purchase conversion value across 15 campaigns.
| Store 2 Metric | Verified Result |
|---|---|
| Campaigns shown | 15 |
| Advertising spend | Rs.382,577.18 |
| Tracked purchase value | Rs.995,030.14 |
| Calculated blended ROAS | 2.60x |
| Purchase value above ad spend | Rs.612,452.96 |
| Purchases on top visible campaign | 105 |
| Cost per purchase on top visible campaign | Rs.1,588.52 |
The strongest visible campaign generated 105 website purchases at a cost of Rs.1,588.52 per purchase. Its tracked purchase conversion value reached Rs.499,503.23 from Rs.166,794.17 in spend, equal to approximately 2.99x ROAS.
This campaign alone contributed roughly half of the account’s visible purchase value, demonstrating why identifying and scaling a genuine winner can materially change account performance.
Results: Store 3
The third store used multiple product-led campaigns, including charger, headphone, power-bank and AirPods-related offers. The account totals showed Rs.310,333.67 in advertising spend, Rs.656,680.36 in tracked purchase conversion value and a reach of 445,403.
| Store 3 Metric | Verified Result |
|---|---|
| Campaigns shown | 13 |
| Total reach | 445,403 |
| Average frequency | 1.76 |
| Advertising spend | Rs.310,333.67 |
| Tracked purchase value | Rs.656,680.36 |
| Calculated blended ROAS | 2.12x |
| Purchase value above ad spend | Rs.346,346.69 |
Two of the strongest visible campaigns generated 49 and 67 website purchases, with costs per purchase of Rs.1,548.36 and Rs.1,354.69 respectively. These results indicated that product-specific campaign structures helped identify offers capable of absorbing more budget.
Combined Advertising Performance
The following totals combine only Store 2 and Store 3 because both screenshots displayed complete account-level spend and purchase-value figures.
| Combined Metric | Result |
|---|---|
| Total advertising spend | Rs.692,910.85 |
| Total tracked purchase value | Rs.1,651,710.50 |
| Purchase value above advertising cost | Rs.958,799.65 |
| Blended purchase ROAS | 2.38x |
For every Rs.1 spent on Meta Ads, the two stores generated approximately Rs.2.38 in tracked purchase value.
Revenue Is Not the Same as Net Profit
A responsible dropshipping case study must distinguish between tracked revenue, gross return and net profit.
The Rs.958,799.65 purchase value above advertising cost is not confirmed net profit because the supplied advertising screenshots do not include:
- supplier or product cost;
- shipping and fulfilment charges;
- cash-on-delivery fees;
- cancelled and returned orders;
- payment gateway charges;
- Shopify or application fees;
- agency or staff costs; and
- taxes and other operating expenses.
The correct formula is:
Net Profit = Delivered Revenue − Product Cost − Ad Spend − Delivery/COD Charges − Returns − Platform and Operating Costs
Final Profit Table Template
| Profit Component | Store 1 | Store 2 | Store 3 |
|---|---|---|---|
| Delivered revenue | Add verified figure | Add verified figure | Add verified figure |
| Product/supplier cost | Add cost | Add cost | Add cost |
| Meta ad spend | Add verified total | Rs.382,577.18 | Rs.310,333.67 |
| Delivery and COD fees | Add cost | Add cost | Add cost |
| Returns/cancellations | Add loss | Add loss | Add loss |
| Platform/operational costs | Add cost | Add cost | Add cost |
| Verified net profit | Calculate | Calculate | Calculate |
Once fulfilment and delivered-order data are added, this table can show the exact net profit without presenting estimated revenue as confirmed earnings.
What Made the Campaigns Work?
Decisions Were Based on Purchases
Clicks and reach were useful diagnostic signals, but purchase volume, cost per purchase and ROAS determined whether a campaign was scaled.
Winners and Losers Were Separated
The wide ROAS range in Store 1 proved that account averages can hide weak campaigns. Budget was more valuable when concentrated on campaigns with stronger buying signals.
Product-Specific Testing Improved Clarity
Store 3’s product-led campaign structure made it easier to compare offers and identify the products generating purchases at lower costs.
The Store and Ads Worked Together
Advertising performance depended on the experience after the click. Mobile usability, offer clarity, trust and checkout simplicity supported conversion.
Scaling Was Controlled
Budgets were increased according to evidence rather than assumptions. Performance was monitored after scaling so that an increase in spend did not silently destroy efficiency.
Key Takeaways for UAE Dropshipping Businesses
These three accounts show that successful dropshipping growth is rarely produced by one advertisement or one product. It comes from a repeatable testing and optimization system.
- Define break-even numbers before spending heavily.
- Track purchase value and cost per purchase—not clicks alone.
- Test several creative angles around the same product.
- Stop weak campaigns before they consume unnecessary budget.
- Scale winners gradually and continue refreshing creatives.
- Separate tracked revenue from delivered revenue and net profit.
- Keep the store, offer and advertising message consistent.
Conclusion
Marketo Solutions helped three separate UAE dropshipping stores move from product and campaign testing toward measurable ecommerce growth. Store 1 achieved a 3.13x average purchase ROAS, while Store 2 and Store 3 generated a combined Rs.1.65 million in tracked purchase value from approximately Rs.692,911 in advertising spend.
The strongest result was not simply more traffic. It was the creation of a structured system for finding winning products and campaigns, controlling acquisition costs and scaling based on real purchase data.
If you want to launch or improve a UAE ecommerce business, explore our dropshipping solutions, review our selected portfolio, or contact Marketo Solutions to discuss your store and growth targets.